Margin after adsfrom −25 %
+0%
Share of revenue left after goods, materials and ads — September against March.
Mar−25 %
Sep+37 %
Mini chart: March – September 2026. Green = the shop made money after paying for the ads.
MyDeko hand-makes soap-rose bouquets and flower boxes. In March 2026, 97 % of the shop’s revenue went on ads, the bestseller cost 119 CZK and every order lost money: once the materials and the ads were paid, nothing was left. Better campaign settings wouldn’t have fixed that. We pulled three levers at once — price and product, the website and customer behaviour, and only then the ads — and every month we decide by one table: margin after ads, i.e. what is left of revenue after goods, materials and ads. In September it was +37 % of revenue. And when we overshot in August, the same table sent us back.








Margin after ads = shop revenue minus goods and materials minus Google and Meta ads. It is what pays for production, running costs and the owner’s income. Revenue and ad spend are shown as an index (March 2026 = 100); revenue excludes VAT and shipping; September runs to the 29th.
Share of revenue left after goods, materials and ads — September against March.
Mini chart: March – September 2026. Green = the shop made money after paying for the ads.
September against March. Orders +194 %.
Index, March 2026 = 100. The June peak was 812.
Up from 1.6 %. Dec–Mar against Apr–Sep.
Mini chart: December 2025 – September 2026. Green = after the website rebuild.
Google + Meta spend as a share of shop revenue in September.
Mini chart: March – September. Green = 60 % or less.
One table decides: while margin after ads grows, we add budget; when it falls, we brake — whatever ROAS the platforms report. Hover or tap a bar for the exact number.
Revenue minus goods and materials minus ads, as a share of revenue. Above zero the shop earns after paying for the ads; below it, it loses. *September to the 29th.
How to read it: the shop first made money after ads in May. August is red on purpose — we tested how much budget the margin could carry, it couldn’t, and in September we cut Meta by 64 %.
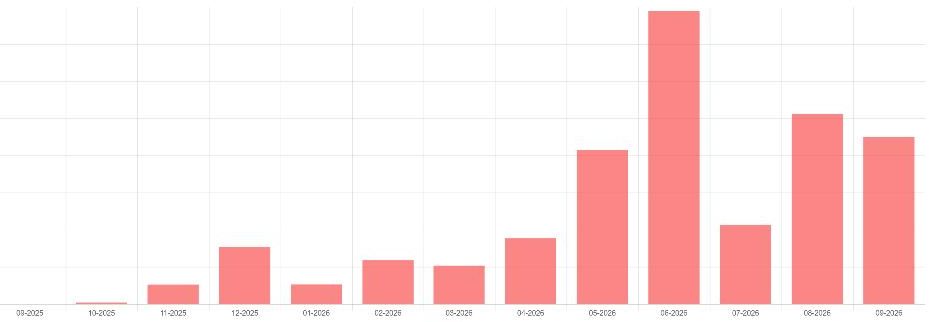
Index, March 2026 = 100. Green = shop revenue, grey = Google + Meta spend. *September to the 29th.
How to read it: in June revenue stood at 812 against ads at 334. In August the two bars are almost equal — that is the month we overshot. September: 468 against 204.
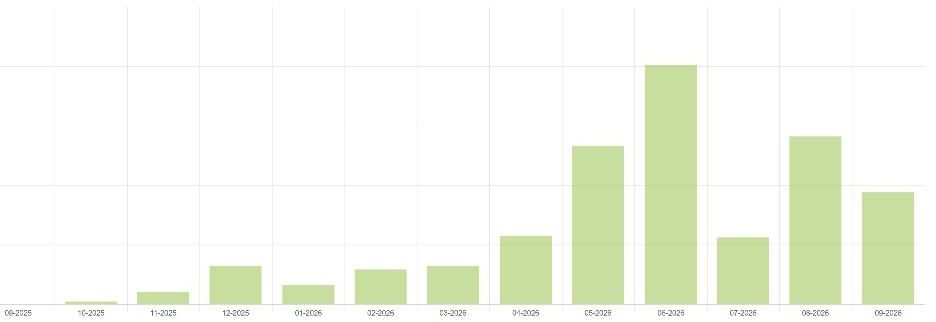
What each crown in Google Ads brought back, month by month. Grey = the previous managers. *September to the 29th.
How to read it: until March Google returned less than it cost. Since April, three campaigns instead of six — Performance Max, search and brand.
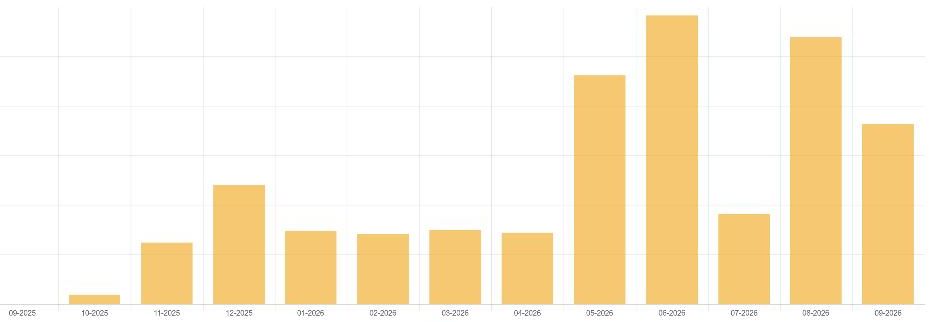
Orders / visits, month by month. Grey = before the rebuild. *September to the 29th.
How to read it: April, the first month after the rebuild, was the best of the whole period (4.0 %). Since then it has held at 2.6–3.4 % — even with far more cold traffic from Meta.
March 2026 (start), June 2026 (peak) and September 2026 (today, to the 29th). Shop revenue from the admin, excluding VAT and shipping; ads from Google Ads and Meta. Swipe the cards; the full tables are underneath.
The yardstick of this study.
01 / 06Index, March = 100.
02 / 06Growth didn’t come from the higher price alone.
03 / 06Dec–Mar against Apr–Sep.
04 / 06Lower is better.
05 / 06Price + add-ons in the basket.
06 / 06March × June × September 2026 · index March = 100
| Metric | March | June | September |
|---|---|---|---|
| Shop revenue (index) | 100 | 812 | 468 |
| Orders | 32 | 201 | 94 |
| Visits (index) | 100 | 391 | 244 |
| Conversion rate | 2.1 % | 3.4 % | 2.6 % |
| Ad spend Google + Meta (index) | 100 | 334 | 204 |
| Ads as a share of revenue | 97 % | 40 % | 42 % |
| Margin after ads | −25 % | +43 % | +37 % |
| Bestseller price (single rose) | 119 CZK | 197 CZK | 219 CZK |
| Average order (index) | 100 | 129 | 159 |
Nov 2025 – Mar 2026 (previous manager) vs. Apr – Sep 2026 · monthly averages
| Metric | Before | After | Change |
|---|---|---|---|
| ROAS | 0.52 | 2.31 | +342 % |
| Ad cost of order value | 192 % | 43 % | −149 pp |
| Cost per purchase (index) | 100 | 28 | −72 % |
| Purchases per month (index) | 100 | 224 | +124 % |
| Order value per month (index) | 100 | 279 | +179 % |
| Spend per month (index) | 100 | 63 | −37 % |
| Active campaigns | 6 | 3 | −3 |
March – 29 September 2026
| Metric | Value |
|---|---|
| Purchases (Mar – 29 Sep) | 459 |
| Share of the ad budget (Apr–Sep) | 81 % |
| ROAS reported by Meta | 1.26 overall · 1.82 in Sep |
| Best ad by spend | “Mýdlová květina jen pro ni” — 36 % of spend, 45 % of purchases |
| Best ad by return | video “Kytice, která nezvadne” — ROAS 1.75 |
Meta and Google each count their own purchases, and together they report more than the shop actually received. That is why we decide by the shop admin, not by the platforms.
Why it matters: revenue in September stood at 468 against March’s 100, but the ads only at 204 — the rest came from the price, the website and the add-ons. The conversion rate almost doubled, so every crown in ads brings more orders than before.
Speed: the conversion rate jumped in the first month after the rebuild (April), the margin turned positive in month 3 (May), peaked in month 4 (June) — and in month 7 the system showed it can reverse too.
Send us an enquiry. We’ll work it out together and tell you whether the ads, the website or the price comes first.
Alex Svoboda hand-arranges soap roses into cones, gift boxes and luxury collections — flowers that smell, don’t wilt and can go in the bath. He sells through his own e-shop, to companies and wholesale, and answers customer reviews personally.
Alex and Jiří from Marketing ASAP first met more than a year ago at a marketing event in Brno. The collaboration started only at the beginning of March 2026 — the brief was clear: grow fast, but only as fast as the margin can carry.

The problem wasn’t in the campaigns. At 119 CZK the ads couldn’t pay for themselves, whoever ran them.
From November 2025 to March 2026 Google Ads returned 52 haléře for every crown — first under the owner, then under an external manager. In March the ads (Google + Meta) cost 97 % of the shop’s revenue and the margin after ads was −25 %: every single order lost money.
What we found:
The ads were losing money because every order was losing money. A better manager wouldn’t fix that — a different price, website and channel would.
March 2026, in four numbers
MyDeko is a workshop, not a warehouse. It needs orders, not fame — and a profit at the end of the month. So we didn’t start with the ads.
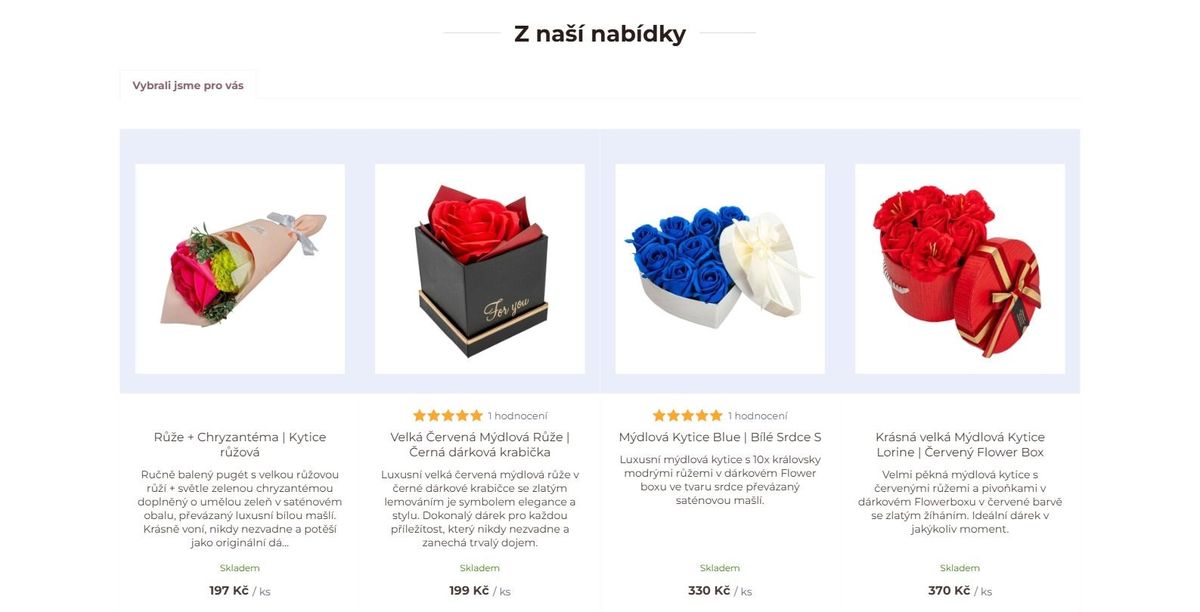
The bestseller from 119 to 219 CZK in seven steps. A premium collection and made-to-order as new categories. Five add-ons in the basket.
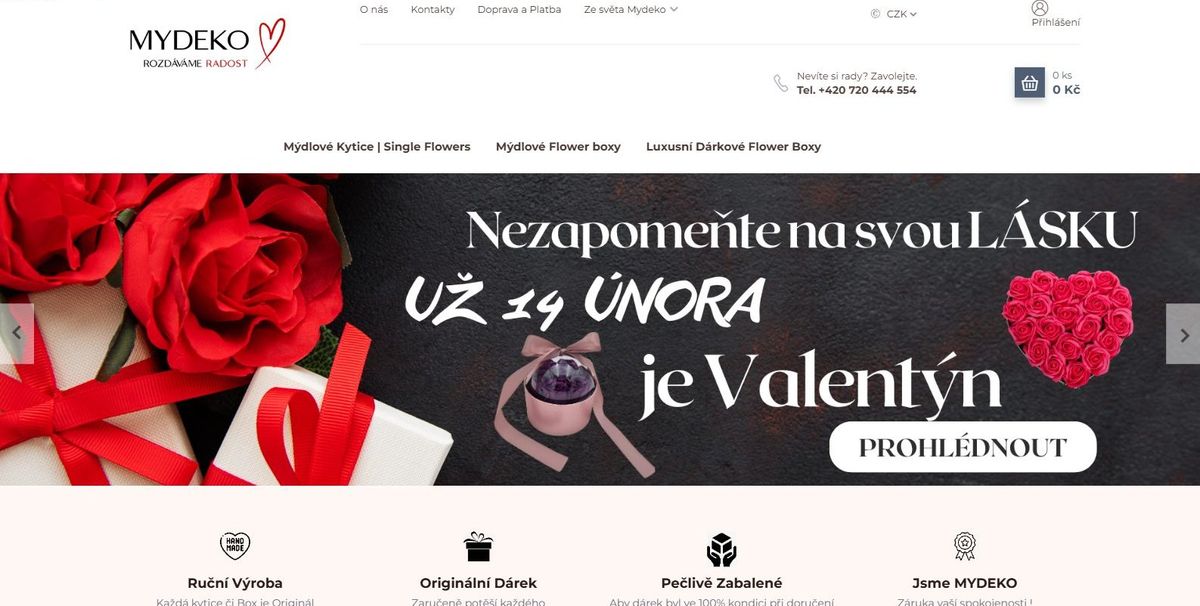
A new shop structure, benefits instead of catalogue copy, premium products on the homepage, reviews. Changes by Microsoft Clarity recordings.
Meta creates demand, Google catches it. A new Meta account with collection, catalogue, remarketing and video; Google cut down to PMax, search and brand.
Every month: revenue, Google and Meta spend, margin after ads. While it grows we add; when it falls we brake.
Four versions of the collection ad, three birthday frames, video with and without captions. Whatever doesn’t earn in 14 days ends.
We proposed prices, the website and budgets; Alex decided and made the changes. We are his sparring partner, not his autopilot.
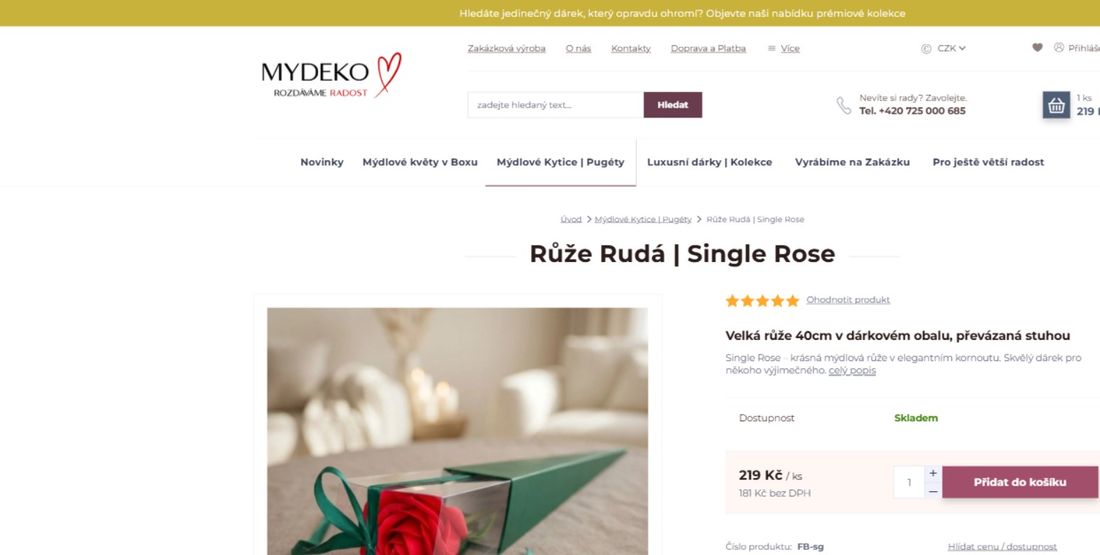
A single rose in a cone is MyDeko’s entry product: the cheapest, the most bought, the one the ads target. At 119 CZK nothing was left after materials and ads. We raised the price by 10–20 CZK at a time and after each step watched whether the conversion rate held. It held — and 219 CZK still applies.
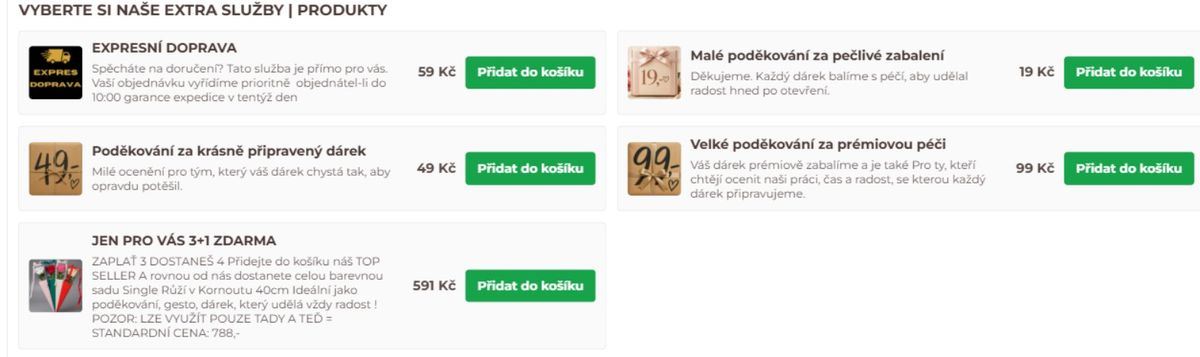
Express delivery, “a small thank-you for careful wrapping”, a fortune cookie, a message card and a 3+1 set. The thank-you for wrapping is now the best-selling item of the whole shop — in 20 % of orders; express delivery in 12 %.
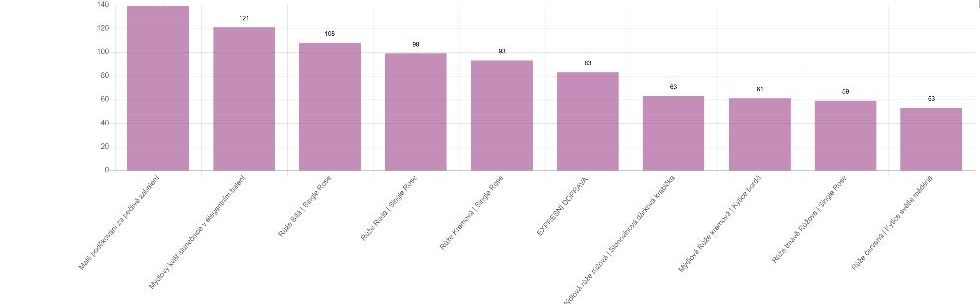
Price first, budget later. The average order in September was 59 % higher than in March. Premium sets with sparkling wine, wedding bouquets and boxes for thousands of crowns raise it and give the brand its level.
Before you scale the ads, work out margin after ads on your average order: revenue minus goods or materials minus ads. If it comes out negative, a better manager won’t help — a different price and a different website will.
We went through the site with Alex page by page and rebuilt it. What to change we don’t decide at the desk — we watch Microsoft Clarity recordings and heatmaps.
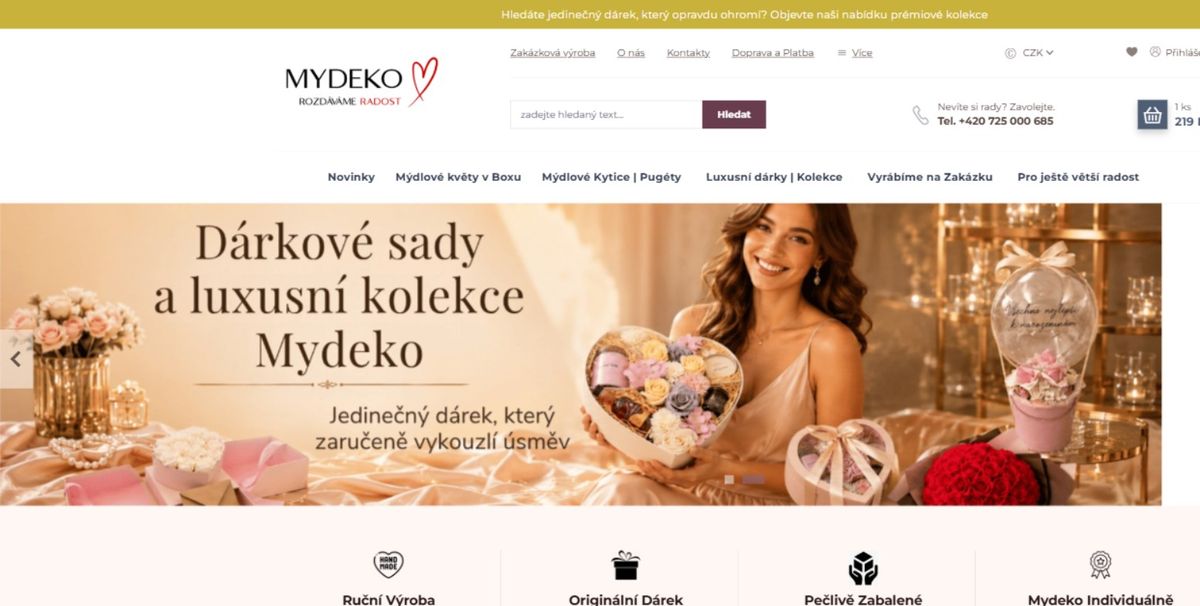
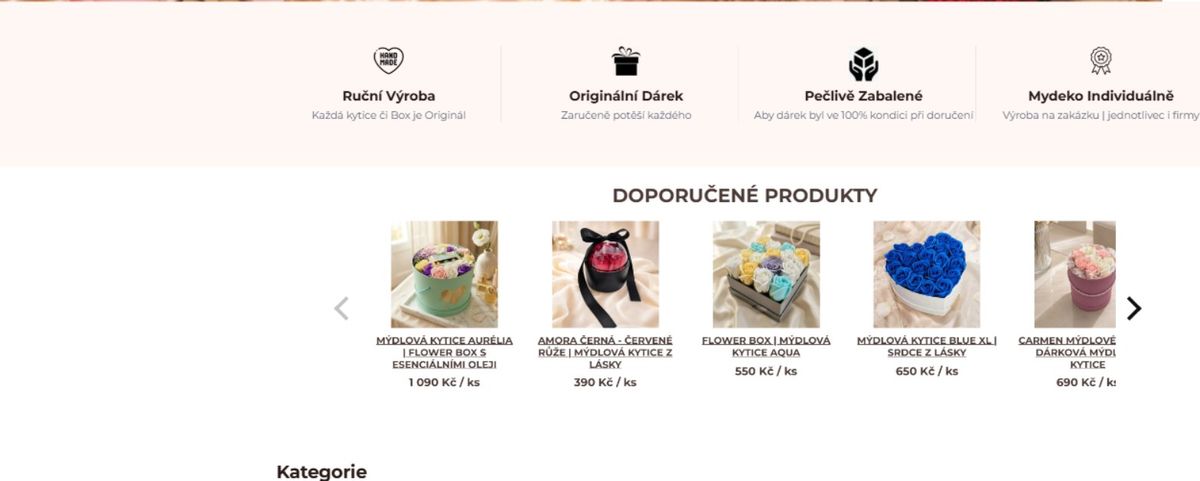
The most visited page isn’t the homepage but the soap-bouquet category — the ads lead straight to it, so we treat it as a landing page. On it the cookie bar takes 17.2 % of all clicks and the gallery arrows 19.7 %: people look at the product from every side before they decide. So photo quality comes first, not more copy.
Clarity, last 30 days. Sessions that added to the basket = 100 %.
Of those who add something to the basket, just over half start an order and fewer than one in five finish it. That can be improved without a crown more in ads — it is next on our list. Among people who re-sort a category by price, 76 % pick “cheapest first”; that is why premium products lead on the homepage and in categories.
Where shoppers drop off between cart and order, and what to do about it, we cover in general in Cart abandonment: why shoppers leave right before they pay.
Nobody searches for a soap bouquet until they see one. So most of the budget went to Meta — 81 % from April — and Google was cut down to catch the demand Meta creates.
Five short videos, each on one reason to buy: it won’t wilt, it goes in the bath, it’s a gift, it’s handmade, it starts at 187 CZK. We A/B test each one with and without captions. “Kytice, která nezvadne” beat the catalogue frame on return (ROAS 1.75 against 1.44) and gets most of the budget in September.
One Advantage+ catalogue, different frames for birthdays, anniversaries, Mother’s Day, a colleague or mum. “Mýdlová květina jen pro ni” carries 36 % of the account’s spend and 45 % of its purchases. Every format in a square and a 9:16 version for stories and reels.




 MydekoSponsored
Kytice, kterou nemusíte za týden vyhodit. 🌸 Mýdlové květiny vyrábíme ručně — každý kus je originál. Nepotřebují vodu, nevadnou a vůni si drží měsíce.
✔ Ruční výroba ✔ Dárkové balení v ceně ✔ Doprava zdarma od 1 200 Kč
MydekoSponsoredVěděli jste, že tuhle kytici můžete použít i do koupele? 🛁 Každý květ je z pravého mýdla. Dokud stojí ve váze, voní. Až se rozhodnete, promění se v koupel.
MydekoSponsoredHledáte dárek, u kterého nebudete na vážkách? 🎁 Mýdlová kytice potěší mámu, partnerku i kolegyni. Nezvadne, nemusí se zalévat a v dárkovém balení dorazí připravená k předání.




On 2 April we switched off Shopping with manual CPCs; display and dynamic had already stopped. On 14 April one Performance Max started with a target ROAS and our own assets — 15 headlines, 16 images, 5 videos. Three campaigns remain: Performance Max, search and brand. Cost per purchase −72 %, purchases per month +124 % on a 37 % lower monthly budget.
Luxusní flower boxy MydekoNaše kytky nikdy nezvadnouMýdlová kytice v boxuNevadnoucí květy růžeRučně vyráběné mýdlové květinyExkluzivní dárky pro ženyMožnost využití do koupeleRozdáváme radost






Creatives are tested fast. Four versions of the collection ad, three versions of the birthday frame, video with and without captions. More than 30 ads tested since March — whatever doesn’t earn in 14 days ends.
Where to find angles for new variants and how to test them against each other is covered in general in How to turn one customer review into five ad concepts.
When a platform reports ROAS 1.2, that doesn’t mean a loss yet. When it reports 3.0, that isn’t a profit yet. Margin after ads decides — once a month, in one table.
When the season plays along we go full throttle; when it doesn’t, we brake.
Seven price steps begin. On 18 March we set up the Meta account and launch the first collection campaign. Margin after ads −25 %.
The rebuilt shop goes live. 2 April: Shopping with manual CPCs off; 14 April: Performance Max starts; 22 April: the main catalogue campaign on Meta. Conversion rate 4.0 %, margin −2 %.
Mother’s Day, a flash campaign, remarketing. Revenue index 406, ads 306. Margin +9 % — the shop earns after paying for the ads for the first time.
The strongest month: revenue index 812 on ads 334, ads at 40 % of revenue, margin +43 %. Google ROAS 3.02.
The gift season fades. We pull the budget ourselves — ads index 133. Revenue falls, the margin stays positive: +20 %.
How far can it go? Budget at the maximum (index 500), the new video “Kytice, která nezvadne”, price step seven to 219 CZK. Revenue 503 — but ads at 96 % of revenue, margin −16 %. The table says: overshot.
Meta budget −64 %, the rest concentrated on the winning video and on Google search. Revenue 468 — almost August’s level on half the ads. Ads 42 % of revenue, margin +37 %, Google ROAS 2.80.
The last twelve months as the shop itself sees them. The Y axis is hidden on purpose.
A shop that lost money on every order in March now has a product that can carry the ads, a website that sells, two channels that complement each other — and a brake that works.
Margin after ads from −25 % to +37 % of revenue in September; +19 % over seven months.
Revenue at 468 against March’s 100 — and the ability to brake hard when the season fades or the budget overflows.
One table instead of platform ROAS; a website that changes by what people do in Clarity, not by gut feel.
Everything that would make these numbers look better than they are, said out loud.
A low base. MyDeko is a small shop and the growth percentages start from a low March base — that’s why we also show ads as a share of revenue, the conversion rate and the margin, which a low base can’t distort.
Growth isn’t linear. July was far below June because the gift season faded and we pulled the budget on purpose.
We overshot in August. We tested how much budget the margin could carry; margin after ads fell to −16 % and the ads swallowed 96 % of revenue. A conscious test of the limit — but one that ended in a losing month. In September we cut Meta by 64 % and the margin went back to +37 %. September also isn’t complete: data to the 29th.
The three levers can’t be separated. Part of the growth is the price (the same order brings 84 % more today), part the website (conversion rate +87 %), part the ads. Meta and Google each report their own purchases and the sum is higher than the real number of orders — we decide by the shop admin.
Why Meta plus Google Ads purchases add up to more than your orders, and how many get counted twice, we cover in general in GA4 vs Google Ads conversions (and Meta): why the numbers never quite match.
The client decided. We proposed prices, the website and budgets; Alex decided on them and made the changes. We didn’t touch production, social media or e-mails.
Where it wouldn’t work. A similar approach works for high-margin goods where the market can take a price rise. For goods with a margin under 30 % the first lever would fail. And the work isn’t done: fewer than one in five people who add to the basket complete the order.
Send this and you get a 90-day strategic plan for raising the performance of your marketing. Free, within 48 hours of account access.
Jan gets back to you within 48 hours, usually with two questions and a time. Then the 90-day plan starts.