Total ad cost of revenue↘ −42 %
0%
Down from 10.9 % of total shop revenue. 70 days before vs. 70 days after the fix.
before10.9 %
after6.4 %
Ad spend as a share of revenue from the shop admin — the one yardstick of this study.
Papírnictví VojTech sells school supplies, backpacks and office goods — in a shop in Znojmo and across Czechia online. When we took over Google Ads at the turn of February and March 2026, the account looked brilliant: by its own numbers, the ads earned more than the whole shop sold. That was impossible. The campaigns were counting items added to the cart as purchases, and counting the same order twice. We fixed the tracking, taught the campaigns real purchases and built new ones around the seasons. Since the fix, ad cost as a share of total revenue is down 42 %.








Total ad cost of revenue = what share of the shop’s total revenue the ads cost. We take it from the shop admin, not from what the ads claim for themselves.
Down from 10.9 % of total shop revenue. 70 days before vs. 70 days after the fix.
Ad spend as a share of revenue from the shop admin — the one yardstick of this study.
With ad spend 28 % lower.
Index, 70 days before the fix = 100.
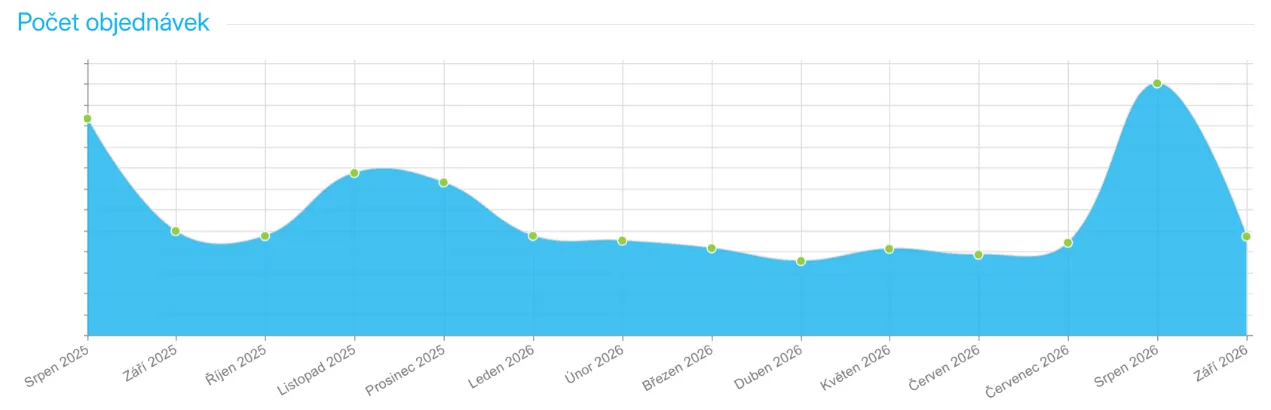
16 Aug – 20 Sep 2026 against July 2026. Orders a day +155 %.
CZK a day from the shop admin. Year on year, same window: +24 % orders.
Under the client’s 12 % ceiling — even with the budget doubled.
Mini chart: what share of revenue the ads claimed, month by month. Green = believable.
What the ads claimed, what the “conversions” really were, and how much of the budget our own campaigns carry. Hover or tap a bar for the exact number.
Google Ads conversion value as a percentage of real revenue from the shop admin. Above the dashed line the ads claim more than the shop sold — impossible, since part of the orders come without ads.
What the conversions and their value were made of, a month into our management.
How to read it: only 8 % of reported conversions were real purchases. Carts and a duplicate purchase tag made up the rest — and 59 % of the reported value.
Campaigns built by Marketing ASAP as a share of monthly Google Ads spend. *September up to the 19th.
How to read it: the rest still runs in the inherited campaigns — retrained on real purchases after the fix, with money moved to the ones that sell.
1 March – 10 May 2026 against 11 May – 19 July 2026, before the school season. Revenue and orders from the shop admin. Swipe the cards; the full tables are underneath.
The yardstick of the study, from the shop admin.
01 / 06Less money for clicks that end in a cart, not an order.
02 / 06All channels together, from the Shoptet admin.
03 / 06Slightly more orders…
04 / 06…and a fifth bigger each.
05 / 06Lower is better.
06 / 061 Mar – 10 May vs. 11 May – 19 Jul 2026
| Metric | Before | After | Change |
|---|---|---|---|
| Total ad cost of revenue | 10.9 % | 6.4 % | −42 % |
| Ad spend a day (index) | 100 | 72 | −28 % |
| Shop revenue a day (index) | 100 | 123 | +23 % |
| Orders a day (index) | 100 | 104 | +4 % |
| Average order (index) | 100 | 119 | +19 % |
| Cost per order (index) | 100 | 70 | −30 % |
1 Aug – 20 Sep, same weeks both years
| Metric | 2025 | 2026 | Change |
|---|---|---|---|
| Orders (index) | 100 | 119 | +19 % |
| Shop revenue (index) | 100 | 101 | +1 % |
| Visits, total (index) | 100 | 138 | +38 % |
| Visits from ads (index) | 100 | 183 | +83 % |
| Organic visits from Google (index) | 100 | 40 | −60 % |
| Ad spend (index) | 100 | 208 | +108 % |
| Total ad cost of revenue | 5.1 % | 10.6 % | target 12 % |
Why it matters: the campaigns stopped paying for people who only park something in a cart. Less money went to clicks that never end in an order, more to customers with bigger baskets.
In the season: with numbers we could trust, we added budget in August — and knew exactly where to stop. Total ad cost of revenue stayed under the 12 % target.
Send us access to Google Ads and to your shop admin. Within a week we will tell you whether your numbers add up.
Papírnictví VojTech sells everything from a ballpoint to a school backpack: pens, notebooks, Topgal and Meatfly backpacks, office supplies, Parker pens and even cake boxes for confectioners. Most orders arrive the next day, with over three thousand pick-up points to choose from.
Google Ads is the shop’s only paid channel. The owner’s goal was clear and sensible: ads may cost at most 12 % of the shop’s total revenue — and as long as they fit, budget should be added, not saved.
When we took the account over, Google Ads claimed more revenue than the whole shop had sold.
The first thing we do with a new account is compare what the ads claim with what the shop admin shows. At VojTech the two did not even come close. From late October 2025, Google Ads claimed between 97 and 151 % of the shop’s entire revenue every month — although part of the orders come without ads at all. In April it was 167 %.
Why Google Ads, GA4 and Meta never quite agree even with correct tracking, and when the gap means an error, we cover in general in GA4 vs Google Ads conversions (and Meta): why the numbers never quite match.
We found the cause in the conversion settings. Since 21 October 2025 — before our time — three things counted as a “conversion” at once:
When the ads claim more than the shop sold, you don’t have great ads. You have broken tracking.
March 2026, in three numbers
The algorithm learns from whatever you mark as success. Here it learned to find people who put things in a cart.
Smart Google Ads campaigns — Performance Max and Shopping with a target return — set bids by whatever the account reports as a conversion. When 81 % of “conversions” are carts, the campaigns learn to find people who like adding to carts. Buying is optional.
The second problem is about decisions. According to Google Ads, the ads brought 142 % more revenue in March than real purchases could prove — so, brilliant, add more. Budget, target return and campaign choice were all steered by a number inflated beyond reality.
Broken tracking doesn’t burn money straight away. It burns it through the decisions made on it.
What we admit
For the first ten weeks we steered the account on the same distorted numbers — we first had to trace exactly what was counted where, and where the two purchase tags came from. In April total ad cost of revenue came out at 13.7 %, over the 12 % target.
April was our signal that waiting cost more than the risk of fixing. Three weeks later the tracking was rebuilt.
We kept one source of truth and moved every other signal where it can’t do harm.
We still see add-to-cart, but campaigns no longer learn from it and its value no longer counts as revenue.
How to measure the cart so it shows where shoppers leave without skewing your campaigns, we cover in general in Cart abandonment: why shoppers leave right before they pay.
The second purchase tag from Google Analytics moved to secondary conversions — one order counts once.
The only primary conversion is now a real purchase with the order value.
Since June the ads claim 54–60 % of revenue and 69–82 % of orders. The rest comes organically and direct — as it should.
In June money moved from the broad Shopping and “in stock & bestsellers” campaigns to product PMax and the new seasonal ones.
Target return moved by at most 15 %, and at least a week apart on the same campaign. The algorithm had to relearn.
The two banners that carried most of the spend after the fix: School supplies and Backpacks — both learning only from real purchases.
The change showed overnight. Ten days after the fix the account reported 94 % fewer conversions than ten days before — and each one finally carried the value of a real order, not a cart.
Open Google Ads and your shop admin side by side for last month. If the ads claim more than 80 % of revenue — let alone more than 100 % — you don’t have great ads. You have broken tracking.
A stationery shop doesn’t sell the same all year. Graduation, weddings and September each need their own campaign, copy and image.
Before our time: carts and a second purchase tag start counting as purchases.
We compare Google Ads with the shop admin. The numbers don’t meet.
Performance Max with its own banners for year-round top-ups.
The only primary conversion = a real purchase with the order value.
Two seasonal campaigns outside the school range.
From campaigns that collected carts to campaigns that sell.
A campaign of its own for the priciest school item.
With numbers we could trust, we could add budget in August — and know exactly where to stop.
Late August is to a stationery shop what Christmas is to a toy shop. The client wanted no saving in the season as long as total ad cost stayed under 12 %. Thanks to the fixed tracking we could raise the budget and see every day what it did to revenue in the admin — not to carts in Google Ads.
From 16 August to 20 September the shop made 32,600 CZK a day against 16,400 CZK in July, with 36 orders a day instead of 14. In the strongest weeks of the year the ads carried 71 % of all shop visits (53 % a year earlier). Organic Google results brought 60 % fewer people year on year. Without the added budget that gap would have stayed open.
+99 % revenue a day against July, +155 % orders — with total ad cost at 11 %, under the 12 % target.
A shop that finally knows what its ads earn — and ads that learn from customers, not carts.
Google Ads claims 54–60 % of revenue, not 167 %. Every budget decision stands on what the shop really sold.
Total ad cost of revenue 42 % lower after the fix. Less spent on ads, shop revenue 23 % higher.
19 % more orders in Back to School and total ad cost 10.6 % — under the 12 % target, even with organic traffic down.
Seasons beyond school: backpacks for the peak, cake boxes for weddings and confectioners.
Everything that would make these numbers look better than they are, said out loud.
Fixing tracking sells nothing by itself. It changed what the campaigns learn from and what we decide by. Alongside it we launched seasonal campaigns for graduation and weddings and moved budget between campaigns — part of the improvement after 11 May is theirs. Both are our work, but they can’t be cleanly separated.
Spring × early summer. The main comparison sets 70 days of spring against 70 days of May to July. We have no same period last year — the shop has run on Shoptet only since July 2025. Against January and February, before our time, the improvement is more modest: daily ad spend 15 % lower, daily revenue 6 % higher, total ad cost from 8.0 % to 6.4 %.
The season was strong on orders, not on revenue. 19 % more orders, but only 1 % more revenue — the average order fell 15 % year on year. We raised ad spend 108 % in the season and cost per order rose 74 %. Total ad cost of 10.6 % is still under the 12 % target the client set precisely so the season would not be starved — but season efficiency is the main thing we want to improve next year.
Organic traffic. Visits from organic Google results fell 60 % year on year, direct visits rose 82 %. Part of that may be a change in how visits are recorded, not a real loss of customers.
Ten weeks on the old numbers. After the takeover we still ran the account on broken tracking for ten weeks. In April total ad cost came out at 13.7 %, over target. We don’t use Google Ads values from before 11 May 2026 for evaluation at all — the only yardstick is revenue from the shop admin.
Send this and you get a 90-day strategic plan for raising the performance of your marketing. Free, within 48 hours of account access.
Jan gets back to you within 48 hours, usually with two questions and a time. Then the 90-day plan starts.