Google Ads conversion value↗ +80 %
+0%
Summer 2026 vs. summer 2025, both 1 Jun – 28 Aug.
2025100
2026180
Monthly value index, Jan 2025 → Aug 2026. Green = months under Marketing ASAP.
Fast growth was never the goal. The client wanted orders to grow only as fast as the shop could ship them — and each one to earn more. We took the account over at the turn of February and March 2026, while we were rebuilding the store's conversion tracking, and ran it as a safe bet: return first, budget second. By summer it was the store's main source of revenue — 59 % of turnover, with ad cost below the 25 % target.







June to August 2026 against the same weeks of 2025. Google Ads only, except store orders. Where the client keeps absolute numbers private, 2025 = 100.
Summer 2026 vs. summer 2025, both 1 Jun – 28 Aug.
Monthly value index, Jan 2025 → Aug 2026. Green = months under Marketing ASAP.
Down from 30.7 %. The client’s ceiling was 25 %.
Monthly ad cost. Green = at or under the 25 % target.
Every crown in Google Ads now brings back 4.58 CZK. It used to be 3.25.
Monthly ROAS, Jan 2025 → Aug 2026. Green = months under Marketing ASAP.
Deliberately slow: the physical shop packs every order, and this is the pace it can handle.
Google Ads share of store revenue: 36 % → 59 %.
Twenty months of the account in three charts. Hover or tap any month for the exact numbers; the table under the first chart has all of them.
Monthly Google Ads conversion value and spend as an index, where 100 is the average month of 2025. Until May the two lines move together. In June and July value runs far ahead of spend; in August they meet again as the budget catches up.
The previous agency leaves. The account runs at a minimum until mid-January.
Marketing ASAP takes over, while the store’s conversion tracking is being rebuilt.
First category campaign (Clocks) and a target ROAS for each campaign.
The account turns: ROAS 5.7. Budget starts to grow, 10 % every 14 days at most.
| Month | Value (index) | Spend (index) | Ad cost |
|---|---|---|---|
| Jan 25 | 64 | 44 | 18.8 % |
| Feb 25 | 100 | 87 | 23.8 % |
| Mar 25 | 93 | 99 | 28.7 % |
| Apr 25 | 111 | 111 | 27.1 % |
| May 25 | 68 | 116 | 46.3 % |
| Jun 25 | 83 | 106 | 34.8 % |
| Jul 25 | 103 | 132 | 35.0 % |
| Aug 25 | 133 | 122 | 24.9 % |
| Sep 25 | 92 | 69 | 20.4 % |
| Oct 25 | 104 | 104 | 27.3 % |
| Nov 25 | 159 | 103 | 17.6 % |
| Dec 25 | 90 | 106 | 32.1 % |
| Jan 26 | 59 | 47 | 21.7 % |
| Feb 26 | 85 | 107 | 34.3 % |
| Mar 26 | 97 | 99 | 27.7 % |
| Apr 26 | 124 | 87 | 19.1 % |
| May 26 | 84 | 96 | 30.9 % |
| Jun 26 | 199 | 128 | 17.5 % |
| Jul 26 | 205 | 161 | 21.4 % |
| Aug 26 | 169 | 171 | 27.6 % |
Monthly ad cost of revenue (spend ÷ conversion value). The dashed line is the client’s ceiling.
How to read it: before the takeover the account was over target in 8 of 14 months, with a worst month of 46.3 %. Since March 2026 it has been under target in 3 of 6 months, including the best month of the whole period — June, 17.5 %.
Share of the Google Ads budget by campaign, summer 2025 vs. summer 2026 (1 Jun – 28 Aug).
How to read it: the catch-all campaign went from 74 % of the budget to 38 %. The three new category campaigns — ceramic sockets, clocks and bulbs — now carry 47 %, each with its own target ROAS.
We cover when and how to split a campaign in general in Why one PMax for the whole store can hold growth back.
Swipe or drag through the ten numbers we track. Each card compares summer 2025 with summer 2026 (1 Jun – 28 Aug); the full tables are underneath.
The headline result: 80 % more value from the same channel, with 28 % more spend.
01 / 10Budget grew, but only after June and only in steps of 10 % — value grew almost three times faster.
02 / 10Return on every crown in Google Ads: 4.58 CZK back instead of 3.25.
03 / 10Lower is better. Now under the client’s 25 % ceiling across the summer.
04 / 10Real purchases only — non-purchase actions were removed from the conversion goals in March.
05 / 10More of the people the ads bring in actually buy.
06 / 10All channels together, from the Shoptet admin.
07 / 10Exactly the pace the shop can pack without hiring.
08 / 10Google Ads became the store’s main source of revenue.
09 / 10Less money riding on one average, more on categories that prove they earn.
10 / 101 Jun – 28 Aug 2025 vs. 1 Jun – 28 Aug 2026
| Metric | Before | After | Change |
|---|---|---|---|
| Google Ads conversion value | 100 | 180 | +80 % |
| Google Ads spend | 100 | 128 | +28 % |
| ROAS | 3.25 | 4.58 | +41 % |
| Google Ads ad cost | 30.7 % | 21.9 % | −8.9 pp |
| Conversions (purchases) | 100 | 176 | +76 % |
| Conversion rate | 2.72 % | 3.54 % | +0.82 pp |
| Total store revenue (Shoptet, all channels) | 100 | 110 | +10 % |
| Store orders (Shoptet, all channels) | 100 | 110 | +10 % |
| Google Ads share of store revenue | 36 % | 59 % | +23 pp |
| Biggest campaign's share of budget | 74 % | 38 % | −36 pp |
1 Mar – 28 Aug 2025 vs. 1 Mar – 28 Aug 2026
| Metric | Before | After | Change |
|---|---|---|---|
| Google Ads conversion value | 100 | 149 | +49 % |
| Google Ads spend | 100 | 108 | +8 % |
| ROAS | 3.17 | 4.35 | +37 % |
| Google Ads ad cost | 31.5 % | 23.0 % | −8.6 pp |
| Conversions (purchases) | 100 | 136 | +36 % |
| Conversion rate | 2.82 % | 3.33 % | +0.51 pp |
| Revenue from google / cpc in GA (last click) | 100 | 143 | +43 % |
| Total store revenue (Shoptet) | 100 | 97 | −3 % |
Why it matters: the growth came from return, not from budget. Over the whole window since the takeover spend rose 8 % and value 49 %; in summer spend rose 28 % and value 80 %. Store orders grew 10 % in summer — a pace the shop can handle — while every crown in Google Ads brought 4.58 CZK instead of 3.25. That is the profit the client was after.
Speed: first new campaign 5 weeks after the takeover, ad cost under target for the first time in month 2 (April), the turn in month 4 (June).
Send an enquiry — we'll look at it together and tell you what can be done.
Screenshots from Shoptet, before and after. Nothing re-drawn.
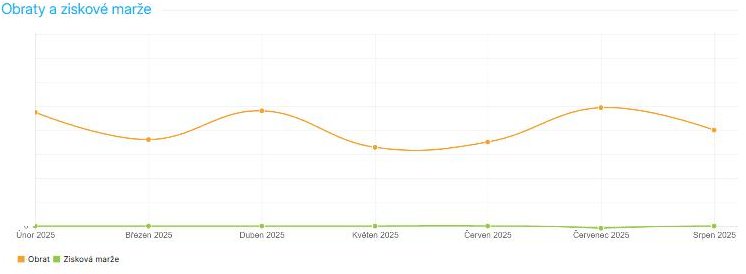
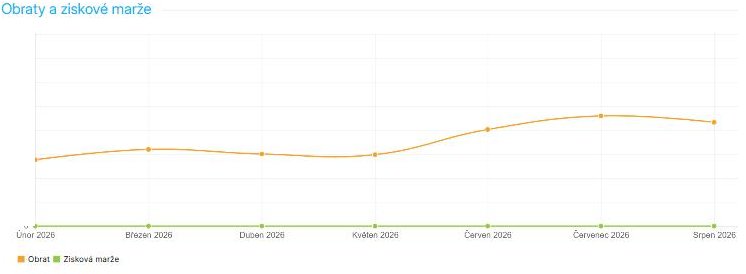
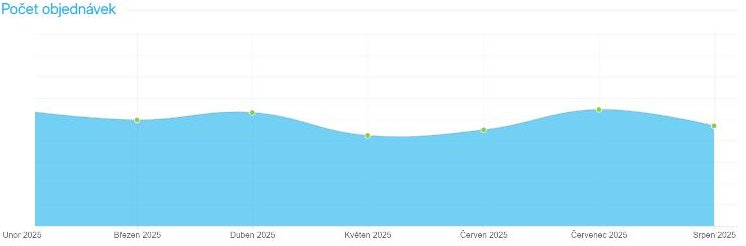
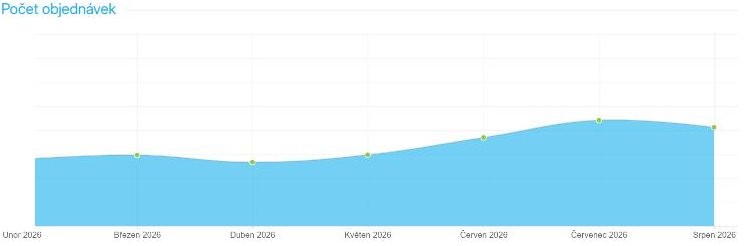
The Y axis on the screenshots is hidden on purpose — the client doesn't publish absolute numbers.
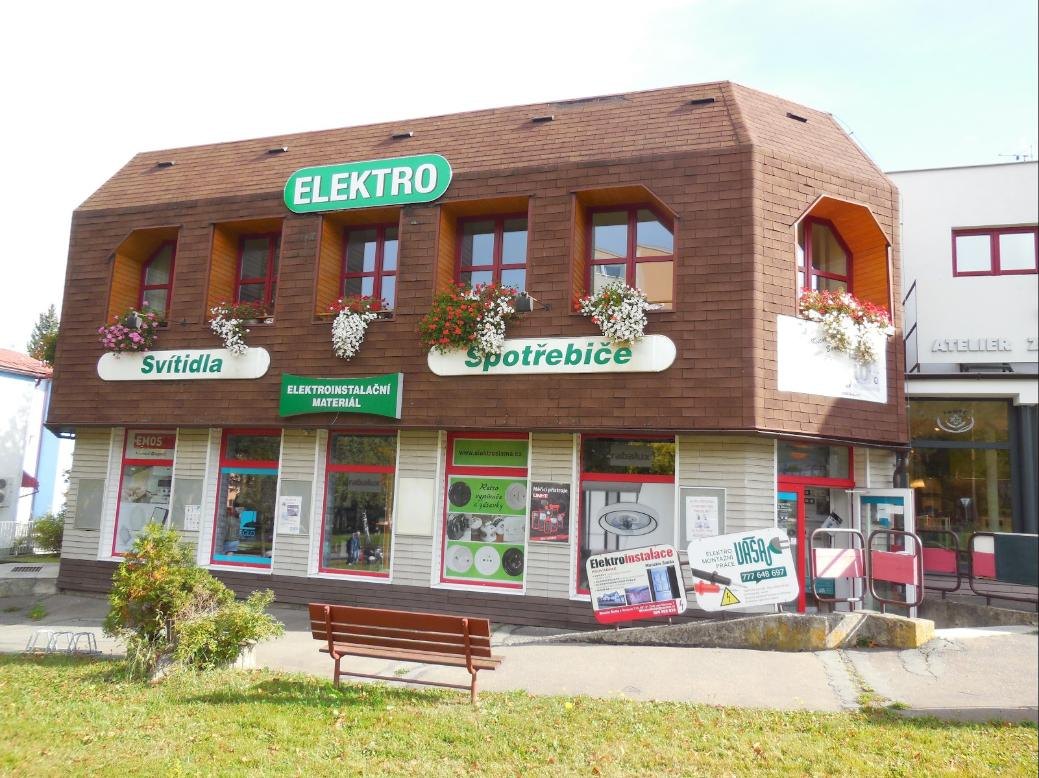
ELEKTRO – M. Sláma is an electrical shop in Žďár nad Sázavou that has also been selling through a Shoptet store since mid-2024. The range is wide: EGLO and GLOBO lighting, LOFT and DPM ceramic and retro switches, JVD wall clocks, bulbs, home appliances and tools.
The store turns over a few million CZK a year, and Google Ads is its main paid channel.
The account ran one campaign for everything — and the bids learned from tracking nobody trusted.
What the client saw: in 2025, Google Ads ad cost moved between 18 and 46 % depending on the month, 27 % for the year. The target was 25 %. The previous agency left in December 2025, the client ran the account himself in January and February 2026, and we took it over at the turn of February and March — while we were rebuilding the conversion tracking.
The actual cause we found:
Business impact: from January to May 2026 the store took 24 % less than a year earlier — a month without ads, two months without a manager, other channels winding down, and then an account re-learning on new tracking.
The account wasn't run on the economics of its categories. It was run on one average that told nobody where the money was made.
Slow growth the shop can handle, and more profit in every order. No step-change scaling.
Starting point · summer 2025 (1 Jun – 28 Aug)
| Account manager | external agency (until 17 Dec 2025) |
| Google Ads ROAS | 3.25 |
| Google Ads ad cost | 30.7 % |
| Conversion rate | 2.72 % |
| Active campaigns | 5, one PMax carries 74 % of budget |
| Google Ads share of store revenue | 36 % |
| Other paid channels | Meta Ads and Sklik, 13 % of revenue in GA |
| Winter 2025/26 | 18 Dec – 13 Jan account at minimum; Jan–Feb run by the client |
| Takeover | turn of Feb/Mar 2026, alongside new conversion tracking |
The client's goal was clear: orders growing only as fast as the shop can pack them, and more profit in each one. Not step-change scaling. So we set the guardrail hard:
Everything else — new campaigns, the rebuilt structure, the pace of growth — answers to that guardrail.
Written down in week one. Every decision in the account since then answers to them.
No new budget until Smart Bidding runs on clean data and ad cost holds the target three weeks in a row. Growth the client can’t ship isn’t growth.
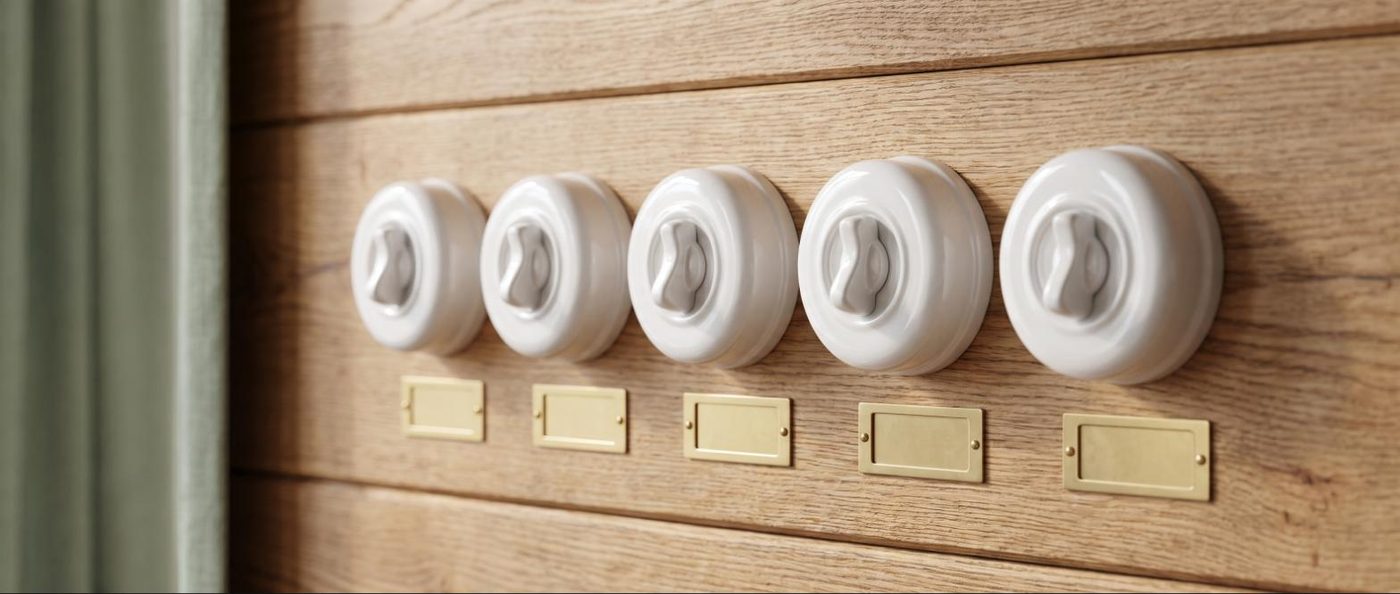
Clocks, bulbs and ceramic sockets each get their own campaign, their own target ROAS and their own budget.
The previous agency's campaigns that earned kept running. We rebuilt only what demonstrably didn't.
Automated bidding needs calm. Jumps in budget or target ROAS were the main cause of the swings in 2025.
Budget goes only to campaigns averaging ROAS ≥ 5.0, 10 % at a time. Weak campaigns get time, not money.
No big bang. One category, then the next — and budget only once the numbers held.
We took the account over while we were rebuilding the store's conversion tracking. Budget stayed where the client had it, and the campaigns that earned were left untouched — first we wanted to see what the new tracking would show.
We removed non-purchase actions from the primary conversion goals, so from March bids optimise only for purchases with value. Why: in February, before the takeover, one campaign reported 107 fake conversions — the algorithm was learning to buy clicks, not orders.
We paused the search campaign for selected products (3 months, 0 conversions). Its budget moved to campaigns with proven return.
A new Performance Max “Clocks” with its own target ROAS of 4.3 and its own assets: 16 headlines, 5 long headlines, 5 descriptions, 6 images from 300×300 to 1200×1200 px, 5 videos. At the same time we set a target ROAS for every running campaign (4.2 to 4.9 by category) instead of one target for the whole account.
Performance Max “Bulbs” (target ROAS 4.5). It turned out to be the weakest campaign in the account; it keeps a small budget and waits for data — no extra money.
Performance Max “Ceramic sockets” — by July already the biggest campaign in the account, holding ROAS 4.5 over the summer. From June we add budget: June–August spend is 57 % higher than February–April.
We split brand queries into their own campaign so they don't flatter the ROAS of the shopping campaigns.
One bid change per campaign every 14 days, ±10 %, never target ROAS and budget together. Negative keywords only for queries with 15+ clicks and zero conversions across the whole account — twice that saved a query that converted in another campaign.
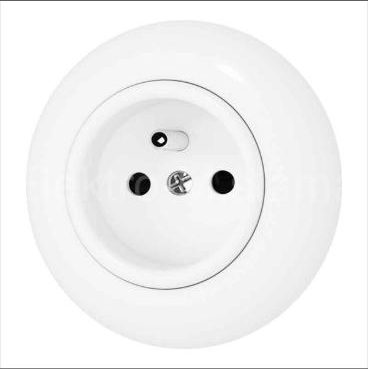
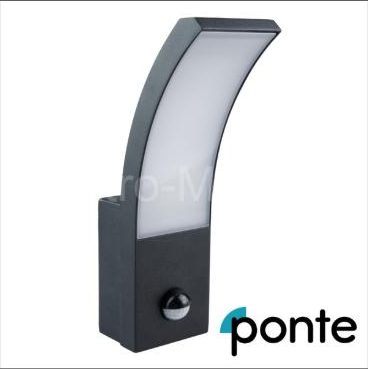
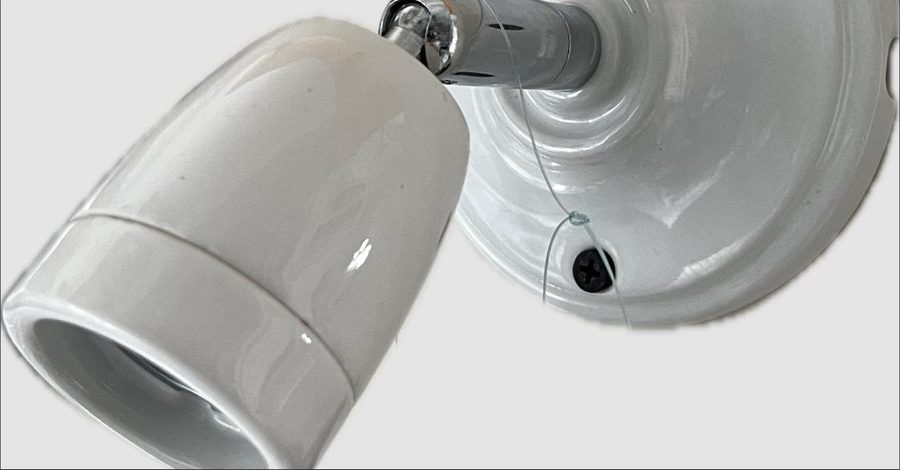
The old catch-all campaign ran on supplier product photos and copy lifted from the store homepage. The new category campaigns got on-brand images and headlines built on why people buy that category.
Headlines of the original campaign — typo included.
Headlines of the new category campaigns.




And the budget came only after it.

Until May we kept the budget at the 2025 level and waited for ad cost to hold the target three weeks in a row. It happened for the first time in April (19 %), May swung back (31 %), and in June the account turned: monthly ROAS 5.7, ad cost 17.5 %. The trigger was clear — the new category campaigns had matured and stopped competing with the original PMax for the same products.
Only then did the budget come, and even that in steps: the new “Ceramic sockets” campaign got its own budget, existing campaigns grew by 10 % every 14 days at most. The result is not a jump but three months in a row in which revenue and orders grew at a pace the shop could ship.
The account turned the moment we stopped feeding one campaign for everything and started steering return by category.
Scale after three weeks of stable ad cost, not after one good week. One strong week is noise; three are a signal.
A store that ran Google Ads with no manager in February 2026 now has one channel carrying most of its revenue, below the target ad cost.
Orders grow by a tenth, not by half — exactly what the shop can handle without hiring. And each one is more profitable: a crown in ads became 4.58 CZK instead of 3.25. The budget can be planned by category: the client knows ceramic sockets and clocks can take more money and bulbs can't. Without the change the account would have carried on like 2025 — ad cost around 30 % and a budget nobody could trace.
ROAS up, ad cost from 31 % to 22 %. Every Google Ads order is cheaper.
Store orders +10 % in summer — without a rush the shop couldn't keep up with.
Budget across 6 campaigns with their own target ROAS instead of one average.
The ads that did the work in summer 2026: Retro switches and Clocks — two categories holding ROAS above 4.
Everything that would make these numbers look better than they are, said out loud.
Part of the year-on-year growth in summer 2026 is a return to normal after a winter in which the account stood still for a month and the client ran it himself for two — but the summer 2025 baseline ran at full speed, so +80 % is not a zero-base effect. The before/after comparison uses values as Google Ads reports them; the tracking rebuild at the takeover (turn of February and March 2026) means data before and after it is not measured in exactly the same way. Total store revenue from January to May 2026 was 24 % lower than in 2025: the account was re-learning and the client wound down Meta Ads. Slow growth also means a faster option existed — with a bigger budget the account would have grown faster, but at a higher ad cost and with orders the shop couldn't ship. August 2026 is counted up to the 28th. Conversion value is Google Ads attribution; GA last-click shows +43 % for google / cpc instead of +49 % over the full window. Similar results depend on the seasonality of the range and on whether the client can hold the 14-day change cycle without stepping in outside it.
Before you add a negative keyword, check that the query doesn't convert in another campaign in the account. Here, two queries that earned money would otherwise have been cut.
Send this and you get a 90-day strategic plan for raising the performance of your marketing. Free, within 48 hours of account access.
Jan gets back to you within 48 hours, usually with two questions and a time. Then the 90-day plan starts.