Ad cost of revenue in Google Ads↘ −47 %
33.1%
Down from 62.5 %. The last 30 days against the month before the takeover.
before62.5 %
after33.1 %
Mini chart: October 2025 – September 2026. Green = 35 % or less.
Letsport is an outdoor e-shop with a store, a gear rental and climbing courses in Ostrava — Rab, Ortovox, Petzl, everything for the mountains, hiking and climbing. When we took over Google Ads at the end of April 2026, ad spend was 143 % higher than in October 2025 and every extra crown sold worse. In the month before the takeover the ads swallowed 62.5 % of the revenue they brought in. We didn’t switch them off. We stopped the auto-applied recommendations, rebuilt the account and brought the budget back down to earth — today the ad cost of revenue is within reach of the client’s 30 % target.




Ad cost of revenue = what share of the revenue Google Ads credits to the ads is spent on the ads themselves. The client’s target is 30 %. We count only purchases with an order value, never contact forms, and compare the last 30 days with the 30 days before the takeover.
Down from 62.5 %. The last 30 days against the month before the takeover.
Mini chart: October 2025 – September 2026. Green = 35 % or less.
With ad spend only 9 % higher.
Index, the month before the takeover = 100.
Cost per purchase 40 % lower.
Only the Purchase conversion with an order value — no contact forms.
In May, our first month, it was 71.7 %.
Mini chart: our five months, May – September 2026.
How the ad cost of revenue and the budget moved before and after the takeover. Hover or tap a bar for the exact number.
The share of the revenue credited to Google Ads that the ads cost, month by month. The dashed line is the client’s 30 % target. *September up to the 25th.
How to read it: the ads were getting pricier long before us — from December, as the budget grew. May was the worst month and it was already ours; since June the bars have been heading back to the target.
Monthly Google Ads spend as an index, October 2025 = 100. *September up to the 25th.
How to read it: in May the inherited settings were still running. In June we cut spend by 47 % — and only then added budget back where it sells.
Google Ads spend as a share of the shop’s total revenue from the admin, all channels together. *September up to the 25th.
How to read it: this is the number the ads can’t claim for themselves — the shop counts it. From 31.8 % in May to 20.1 % in September.
27 Aug – 25 Sep 2026 against 29 Mar – 27 Apr 2026. Data from Google Ads, shop revenue from the admin. Swipe the cards; the full tables are underneath.
The yardstick of this study.
01 / 06What Google Ads credits to the ads.
02 / 06Only purchases with an order value.
03 / 06Practically the same budget.
04 / 06Fewer clicks that end without an order.
05 / 06Lower is better.
06 / 0629 Mar – 27 Apr vs. 27 Aug – 25 Sep 2026
| Metric | Before | After | Change |
|---|---|---|---|
| Ad cost of revenue | 62.5 % | 33.1 % | −47 % |
| Revenue from ads (index) | 100 | 206 | +106 % |
| Purchases from ads (index) | 100 | 183 | +83 % |
| Ad spend (index) | 100 | 109 | +9 % |
| Clicks (index) | 100 | 120 | +20 % |
| Cost per purchase (index) | 100 | 60 | −40 % |
| Conversion rate (index) | 100 | 152 | +52 % |
| Average order from ads (index) | 100 | 113 | +13 % |
| Shop revenue, all channels (index) | 100 | 110 | +10 % |
1 May – 25 Sep 2026
| Campaign | Share of spend | Ad cost of revenue |
|---|---|---|
| Inherited PMax for products | 77.0 % | 41.4 % |
| PMax Climbing (ours, from 5 Jun) | 20.0 % | 56.2 % |
| Brand search | 3.0 % | 22.2 % |
The inherited Performance Max still carries most of the budget — at a far better ad cost of revenue than in spring.
Why it matters: the budget is practically the same as before the takeover. The difference is what it buys: a conversion rate half as high again and a 13 % bigger average order. The ads stopped paying for clicks that don’t end in a purchase.
Honestly: the whole shop sold only 10 % more in those 30 days. The account is getting back to sensible efficiency first; growing the shop is our job for the winter season.
Send us access to Google Ads. Within a week we’ll tell you how much of your budget is run by recommendations and what it does to your ad cost of revenue.
Letsport sells gear for the mountains, hiking, climbing and camping — Rab, Ortovox, Petzl, Kilpi and more. Items in stock ship the same day, there is a store and a rental in Ostrava-Mariánské Hory, and the team runs climbing courses. A customer here is often not a one-off purchase but someone who also comes in for advice.
Google Ads is the main paid channel. The brief is clear: keep the ad cost of revenue at 30 % and still grow in the long run — add budget only where it fits the target.
From October to April ad spend grew 143 % and the ad cost of revenue went from 24 to 62 %.
In October 2025 the account spent sensibly and the ad cost of revenue was 24.2 %. Then the budget started to grow — by January it stood at index 244 against October — and the cost of revenue grew with it: 41 % in January, 45 % in February, 56.5 % in April. In the month before the takeover (29 March – 27 April 2026) the ads swallowed 62.5 % of the revenue they brought.
The change history shows whose hand it was:
When the budget rises by recommendation while the target falls, the outcome is certain: more clicks, pricier sales.
April 2026, in three numbers
First stop the automation, then bring the budget down, and only then build.
From 15 May no recommendation applies itself. Budgets and targets are changed by a person, by the client’s target.
In June spend fell 47 % month on month and the ad cost of revenue went from 71.7 to 41 %. The account stopped falling.
From 5 June: Performance Max for climbing gear with our banners, copy about specific brands and our own search themes.
In August the zero-value “Contact” moved to secondary conversions. The campaigns now learn from purchases only.
Target return moves by at most 0.2 and at least 7 days apart; budgets by at most 20 % a day. Nothing switches itself on or off.
Bids and budgets are checked every day. Budget goes up only where a campaign meets the target.


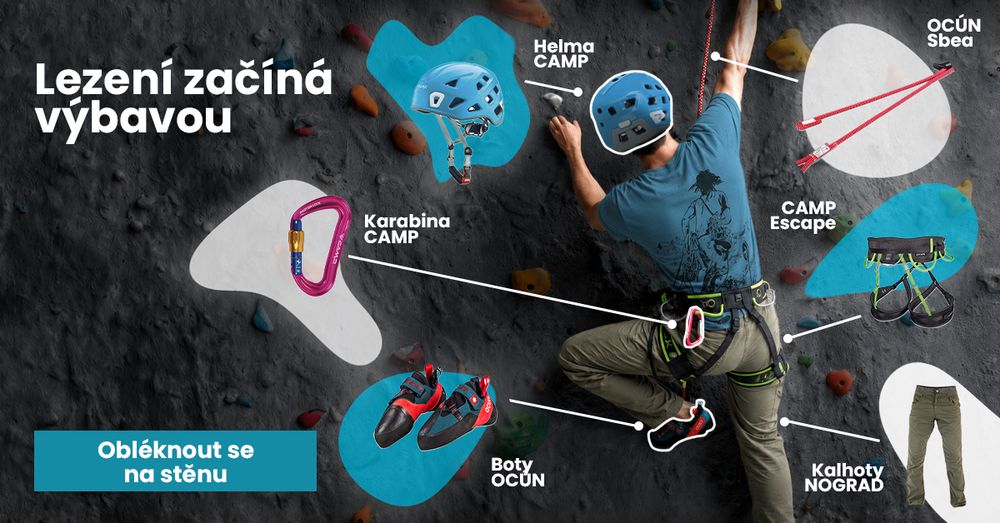
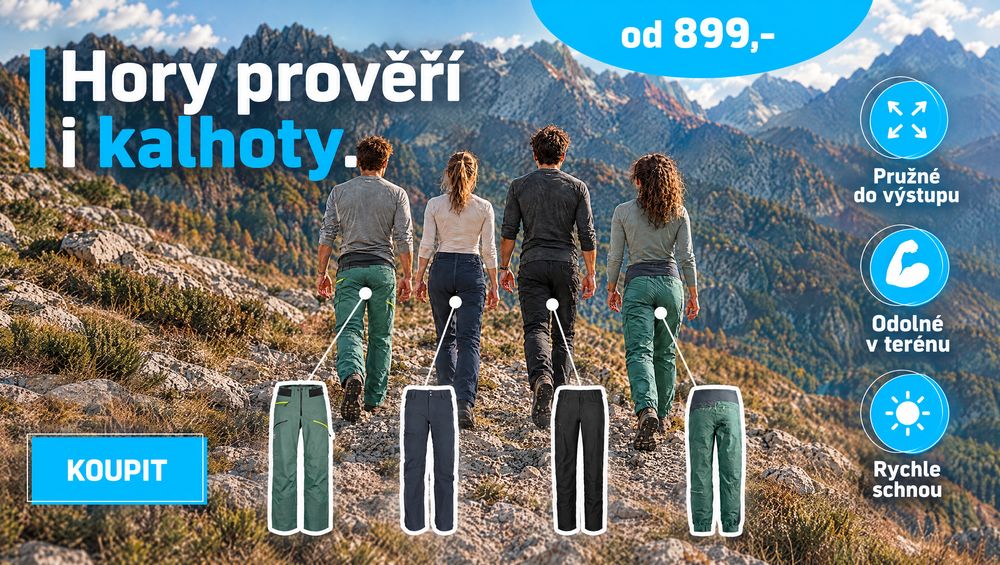
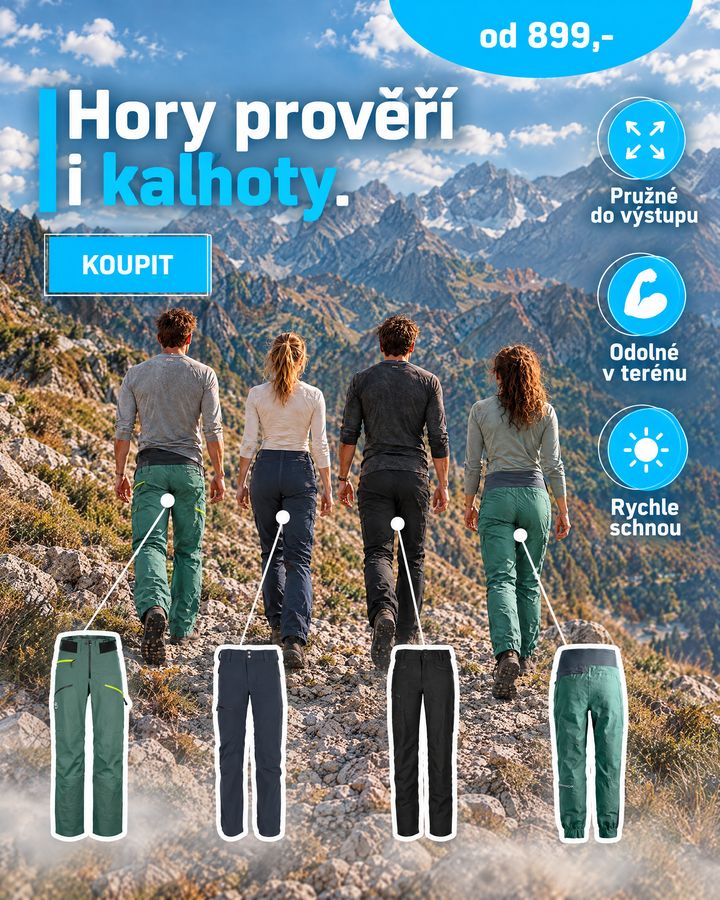
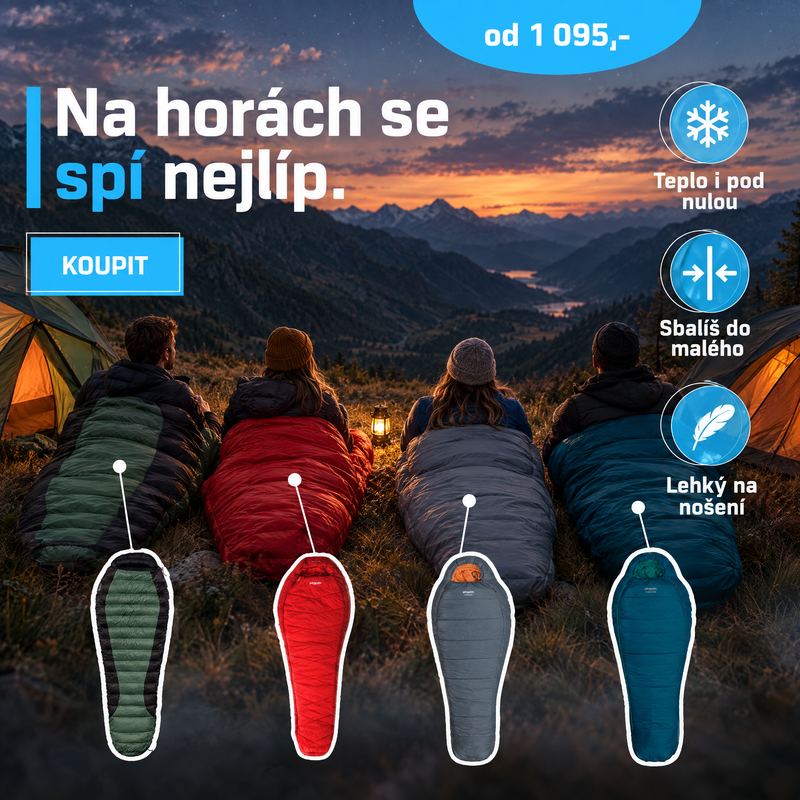
Our category banners for autumn and winter: every product in the picture can be bought, with a starting price.
Nothing was switched off in a panic. The inherited Performance Max kept running — with a person setting its target and budget. We cut first, and added only where the numbers allowed.
In Google Ads open Recommendations → Auto-apply. If budget or target recommendations are switched on, someone other than you is deciding what your ads cost.
Outdoor gear isn’t bought on a slogan but on brand, material and fit.



When Performance Max has no video of its own, Google stitches one together itself. So we put three videos from Letsport’s YouTube channel into the new asset groups — real footage from the mountains, with products. Videos Google generated by itself don’t count among our creatives.



Brands in stock, same-day shipping, advice and a real store in Ostrava. The same message in the brand campaign and in the new search campaign for shoe insoles.
Rab · Ortovox · Petzlsame-day shippingstore in Ostravagear rentaladvice
From the takeover to three new asset groups for the winter.
An audit of structure, tracking and recommendations. The budget still runs as it was set — May will end with the worst ad cost of revenue of the year (71.7 %).
We take back control: main PMax and brand settings, no more budget added by recommendation.
Spend −47 % month on month, ad cost of revenue from 71.7 to 41 %.
Our own campaign for climbing gear, with our banners and search themes.
A higher target return for brand, adjustments to the main PMax. In small steps, not in one jump.
“Contact” goes to secondary conversions; the daily check with hard limits starts.
A separate campaign for a category people search for by name.
Women’s clothing, Backpacks & bags, Winter traction. Three live groups instead of thirteen old seasonal ones.
Inside Google Ads you only see what the ads claim for themselves. So we also watch the shop’s total revenue.
Ad spend as a share of the shop’s total revenue fell from 31.8 % in May to 20.1 % in September. Ads now cost a fifth of what the whole shop sells, all channels included.
It is fair to say what this doesn’t mean yet. In the last 30 days the shop as a whole sold only 10 % more than in the month before the takeover, and year on year (May–September) it has 6 % lower revenue on 20 % more orders. The account is returning to sensible efficiency first, not to fast growth. Growth is our job for the winter season.
Ads cost 20 % of the whole shop’s revenue today. In May it was 32 %.
From the shop admin
An account run by a person again, by the client’s target — not by recommendations that apply themselves.
Ad cost of revenue from 62.5 to 33.1 %. Every purchase from ads costs 40 % less than before the takeover.
Targets and budgets move in small steps, are checked every day, and nothing switches by itself.
Four live campaigns instead of twenty-seven: a climbing campaign, search for insoles and three new asset groups for winter.
Everything that would make these numbers look better than they are, said out loud.
May was the worst month of the year — and it was already ours. We took over at the end of April but made the first changes on 15 May; until then the account ran as it was set. The ad cost of revenue for May came out at 71.7 %. Had we touched the account in the first week, May would have been better.
Year on year the numbers are worse, not better. From May to 25 September 2026 the ads cost 220 % more than in the same period of 2025 and brought 63 % more revenue — so the ad cost of revenue rose year on year from 22.0 to 43.0 %. The budget increases began in December 2025, five months before our takeover; so far we are bringing the account back to efficiency, not to last year’s values. Last year Sklik ran too and this year it doesn’t, so paid traffic from Google is up 110 % year on year.
Our new campaign still sells at a higher cost than the account as a whole. PMax Climbing has run at 56.2 % cost of revenue since launch, on a fifth of the spend. We keep it running with its own target because it opens a category the account never had on its own — but so far it is an investment, not a result.
Until August the campaigns also learned from contacts. The zero-value “Contact” conversion action was among the primary conversions until early August 2026. The “conversions” number in the account was inflated until then — which is why this study counts only purchases with an order value.
What exactly we measure. Revenue and purchases from ads are what Google Ads credits to the ads under its own model — with the same settings in both compared periods. Shop revenue comes from the admin and includes all channels. The client’s 30 % target isn’t met yet: September will end at 32.3 %.
Send this and you get a 90-day strategic plan for raising the performance of your marketing. Free, within 48 hours of account access.
Jan gets back to you within 48 hours, usually with two questions and a time. Then the 90-day plan starts.